Turf Intelligence Platform

Quantify your course
Gain data-driven insights

A Visual Memory for Your Golf Course

Capture a photo from the air or phone. Grass Buddy turns it into a scored health map in seconds — every hole, every zone, tracked across the season. Act on data, not instinct.


Instant Turf Health Score
Hole +  Zone Tracking
Director's Reporting Course Performance
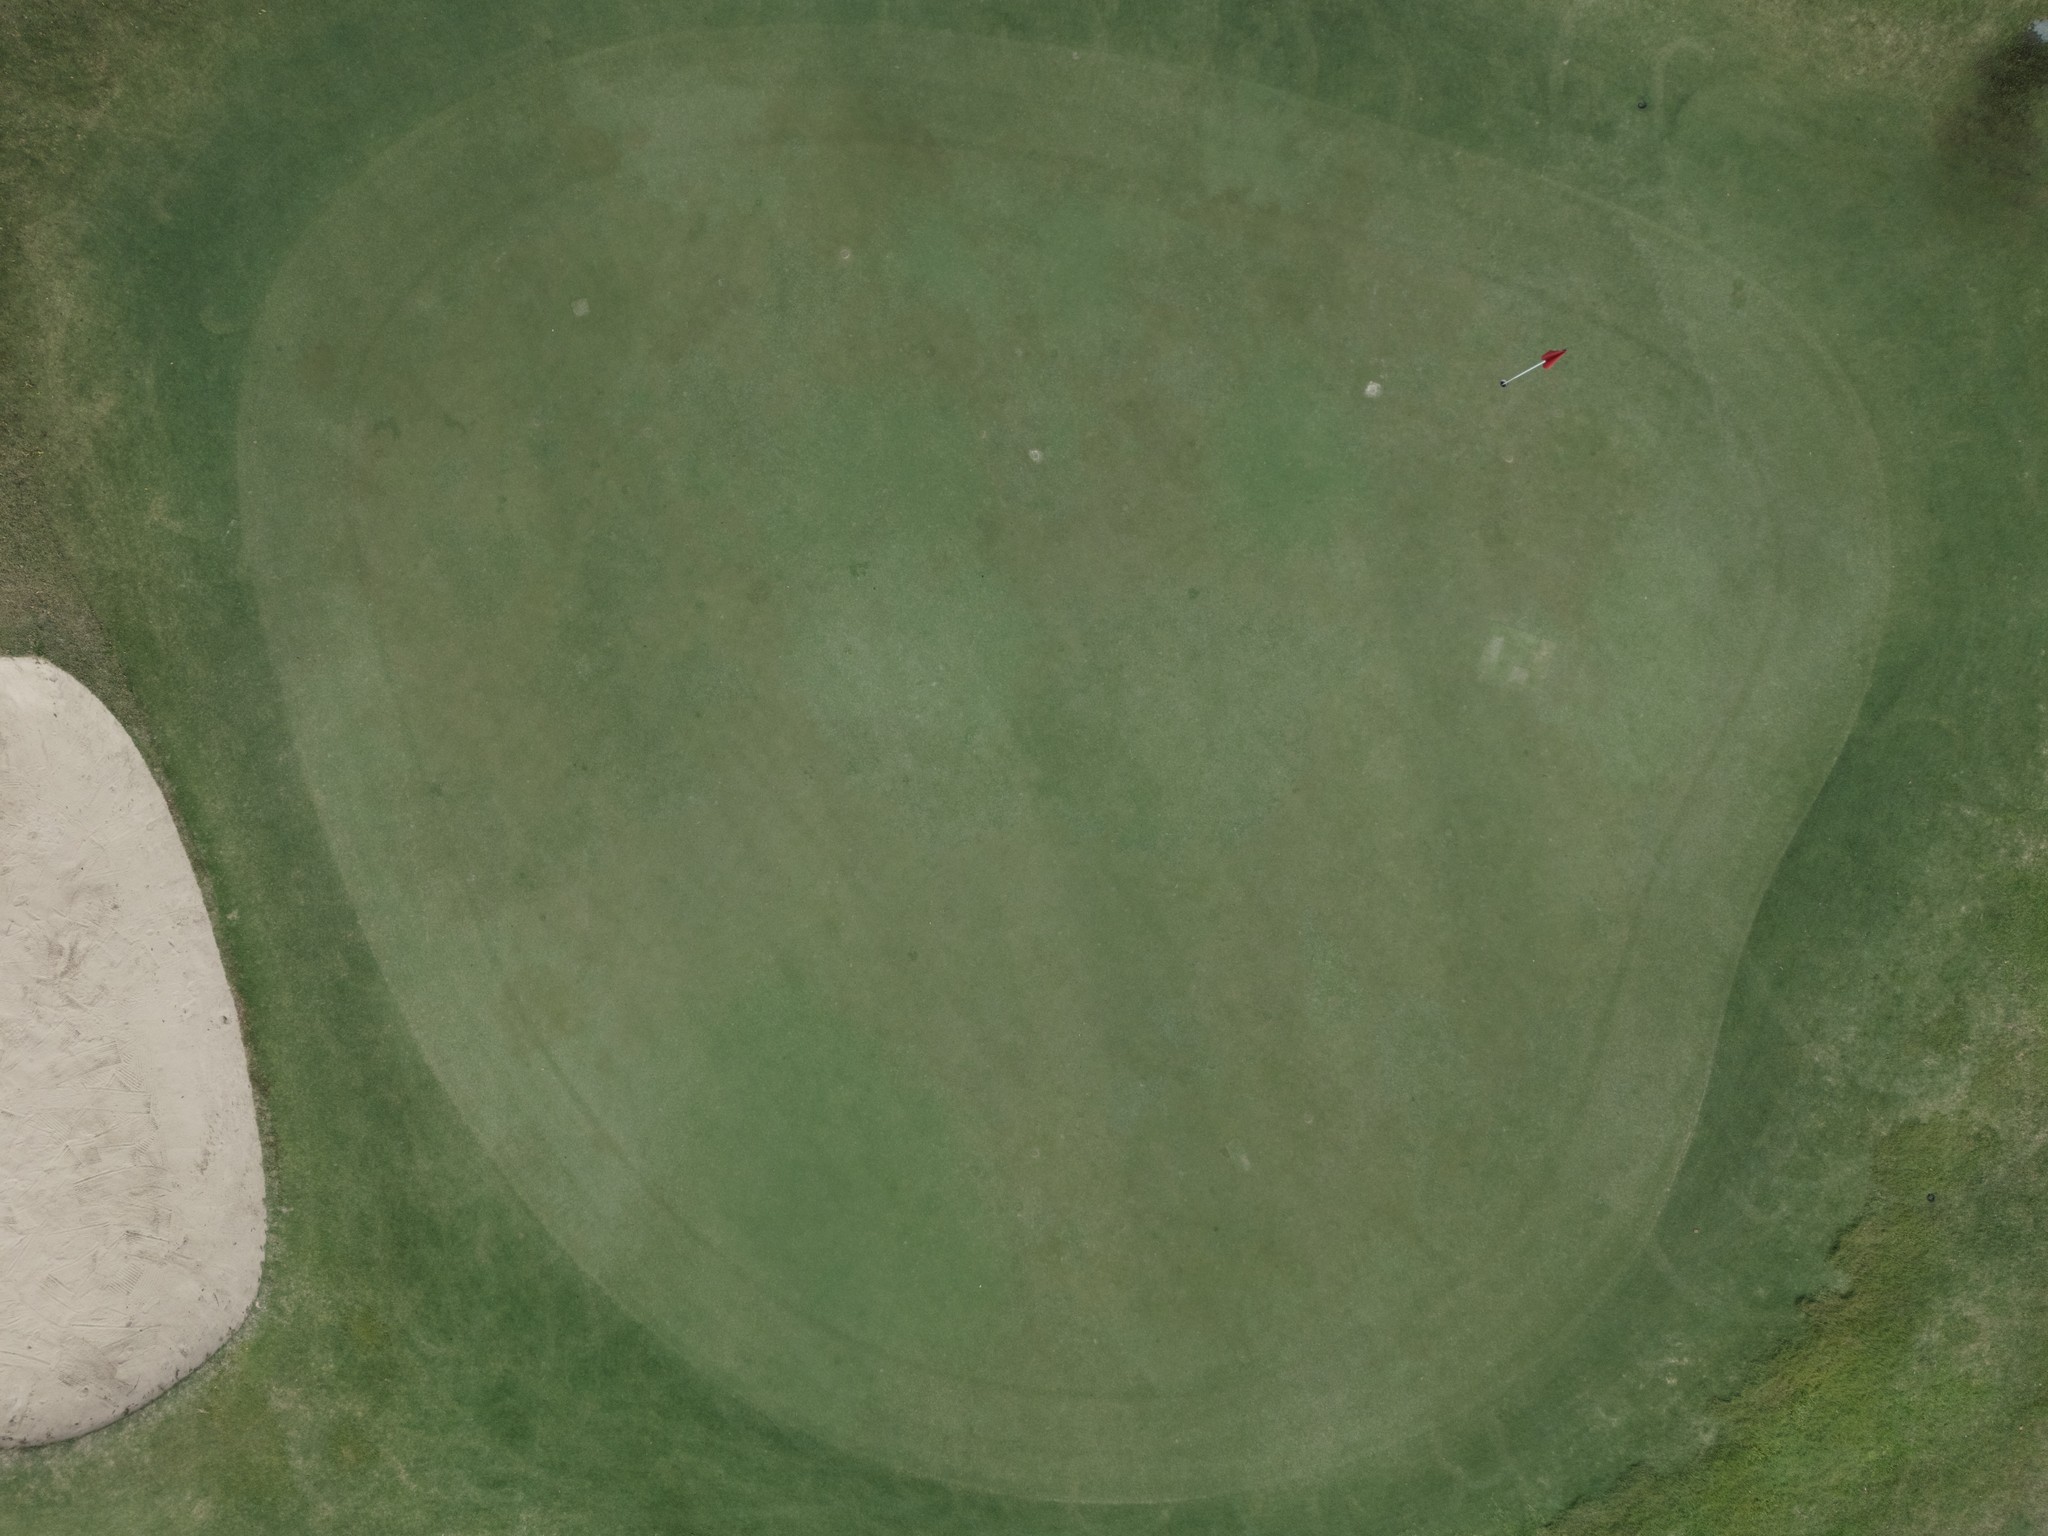
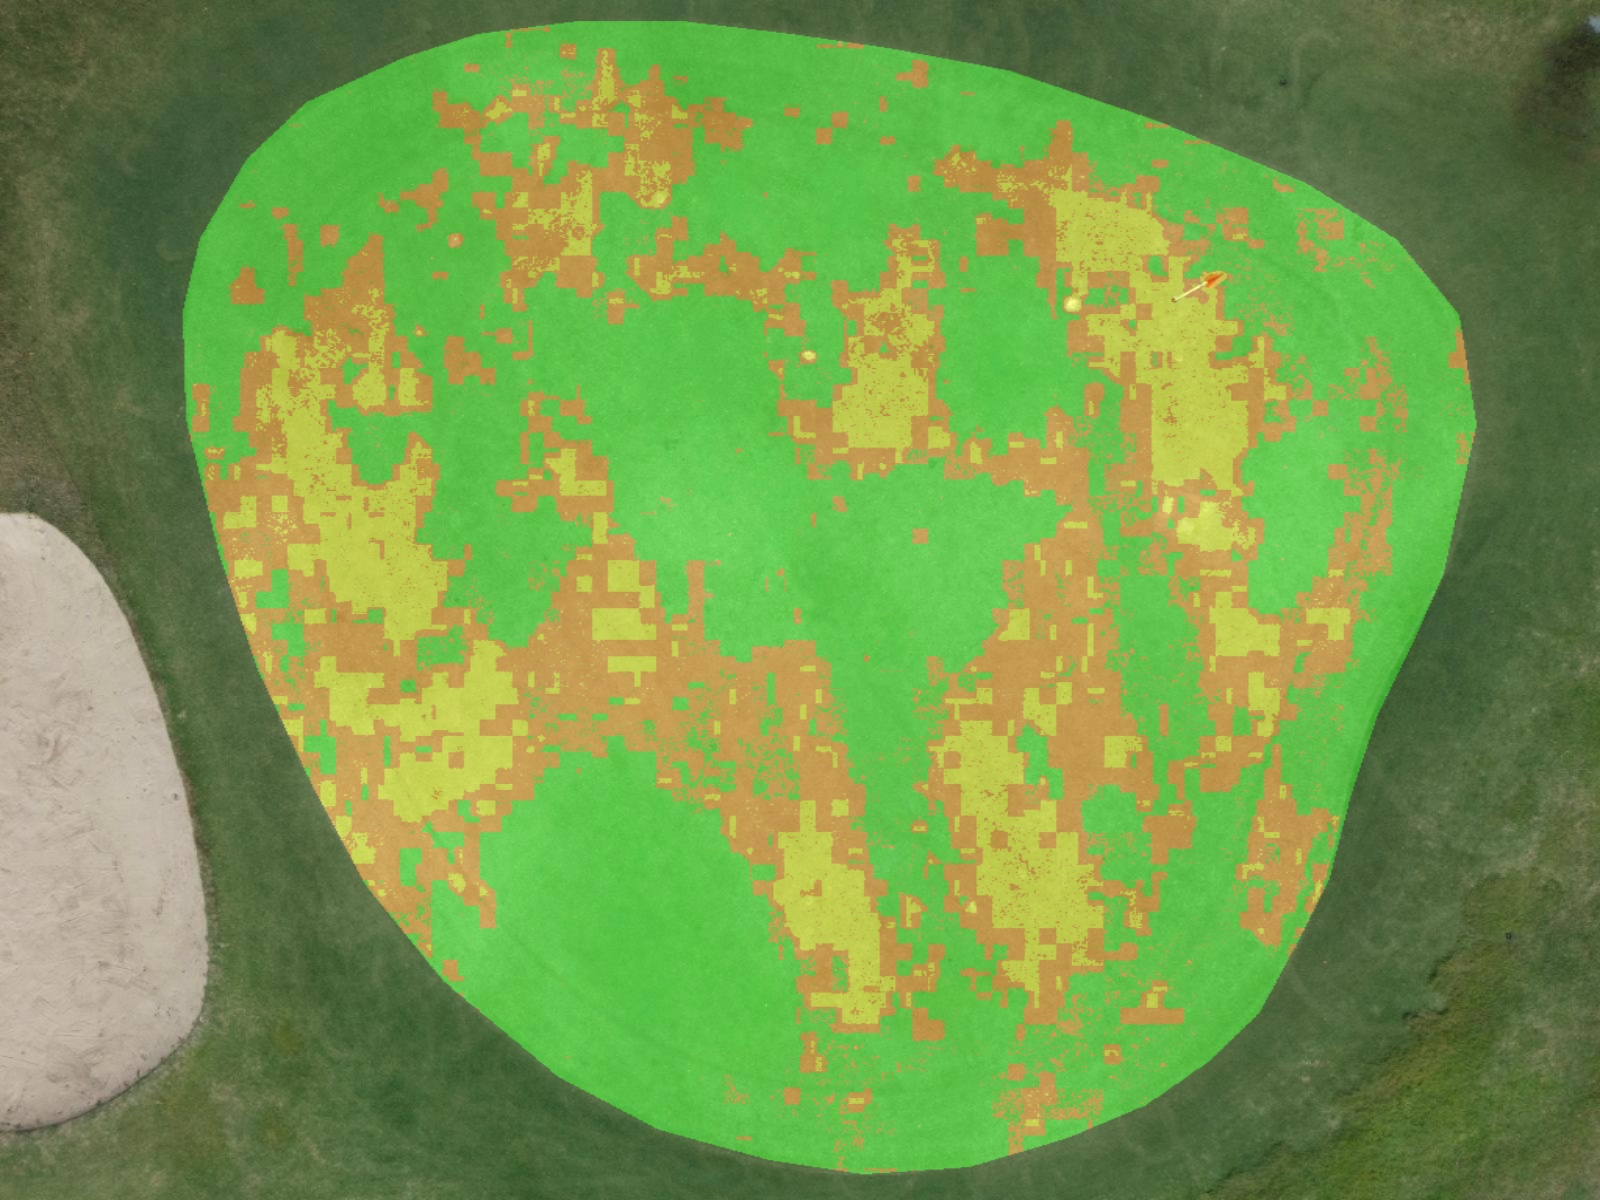
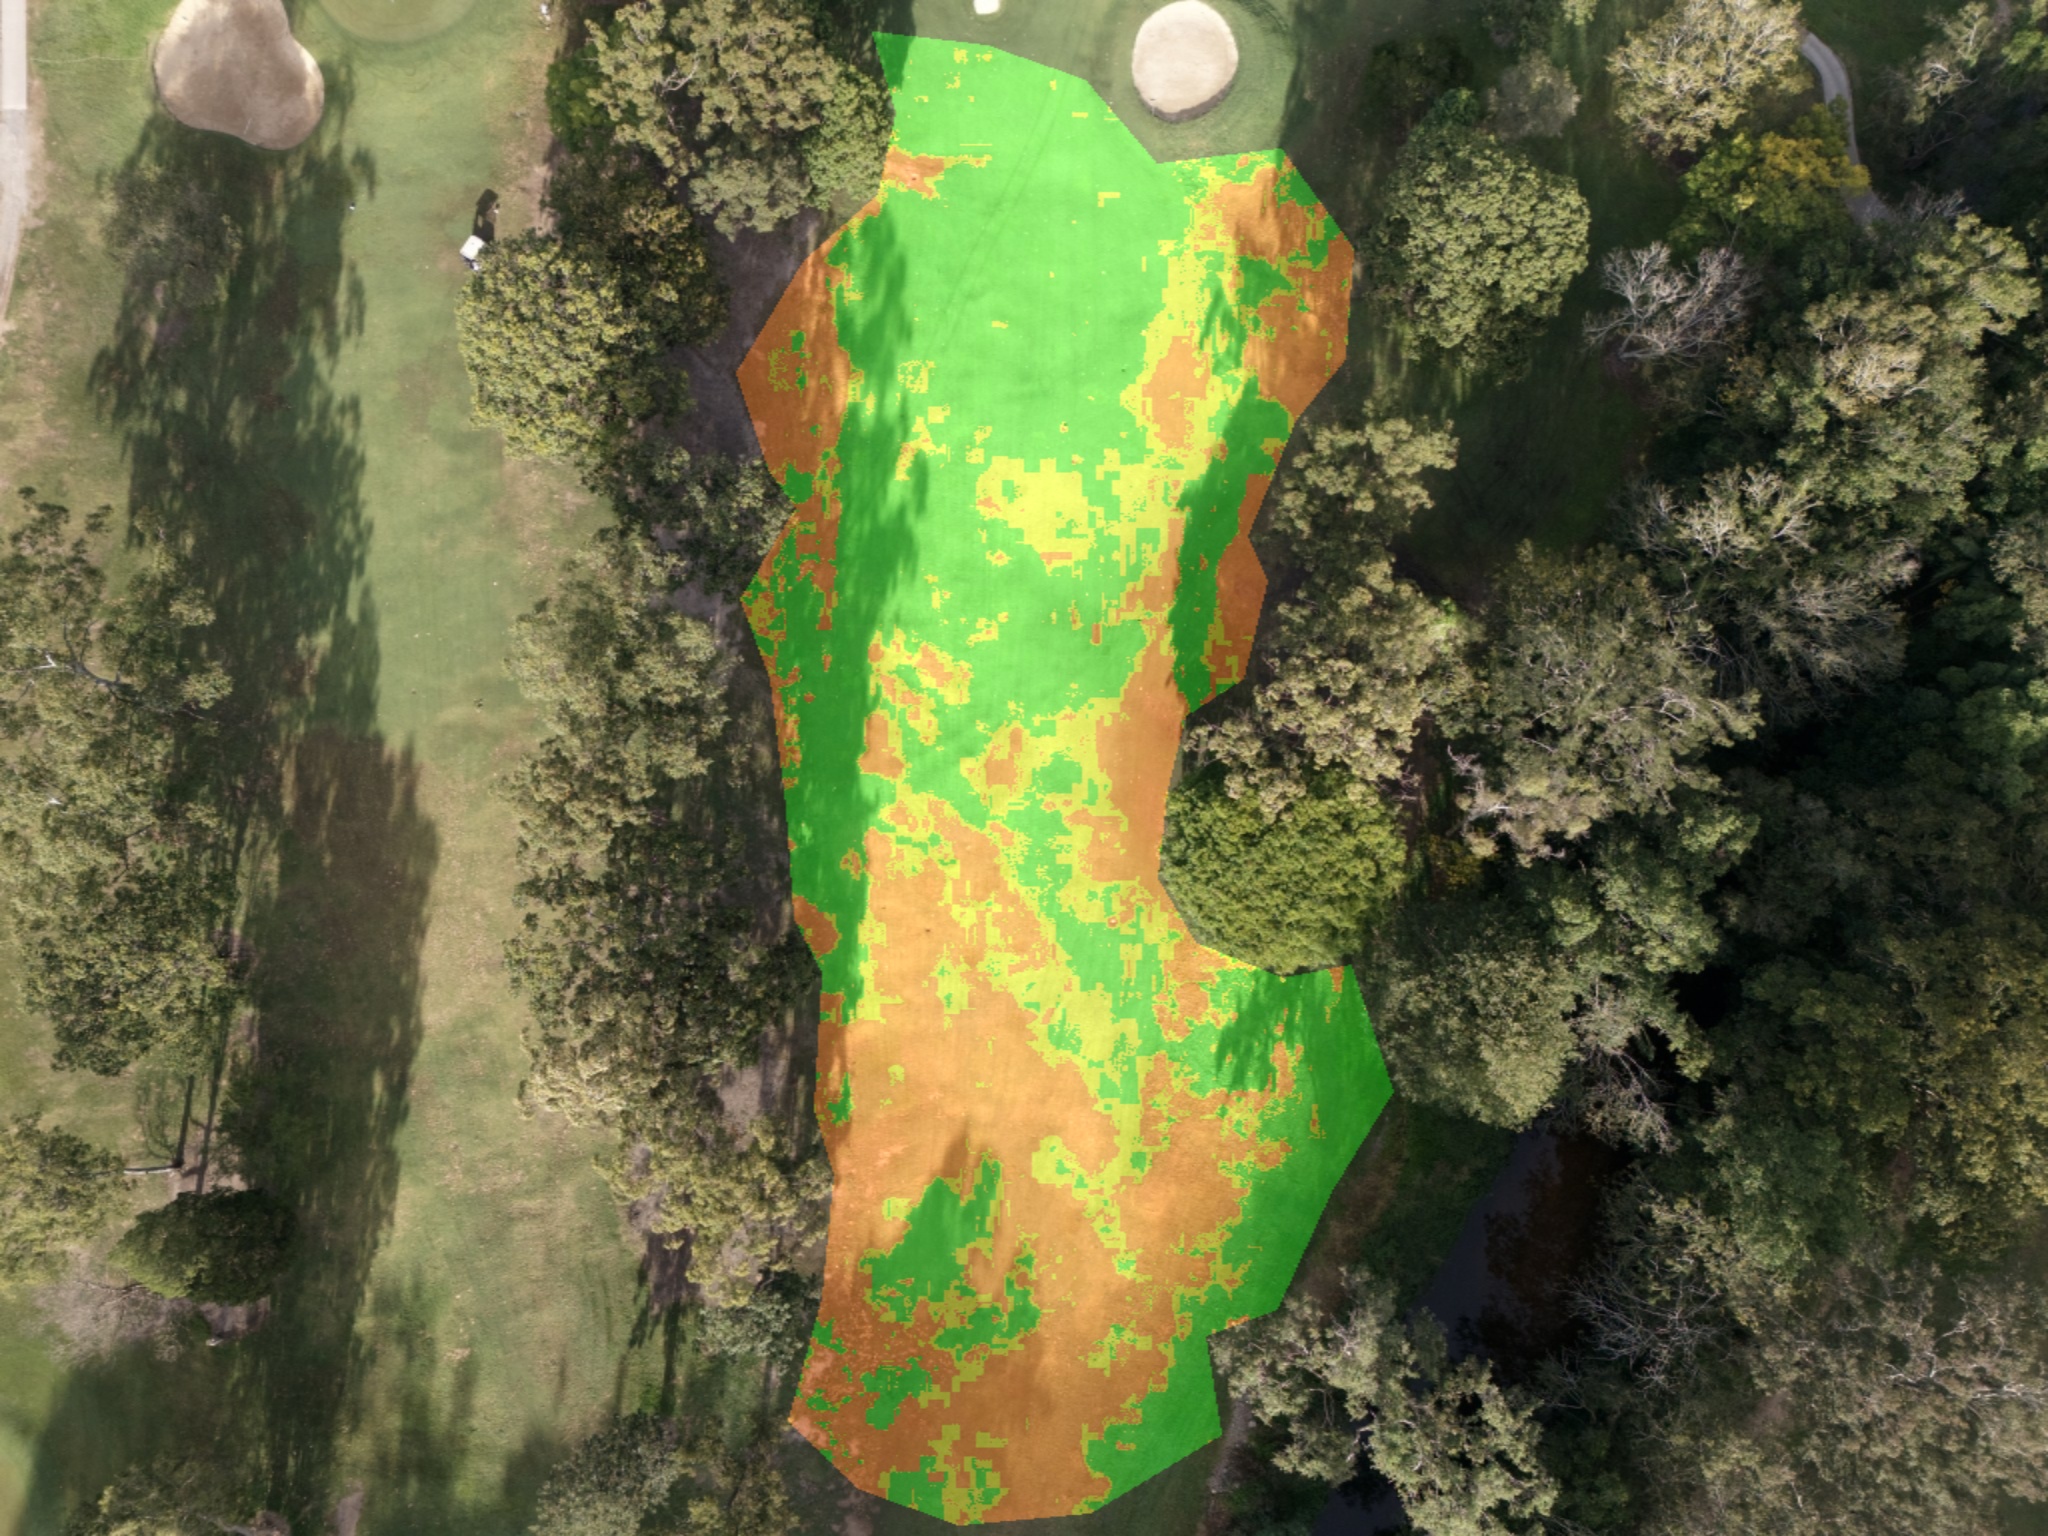
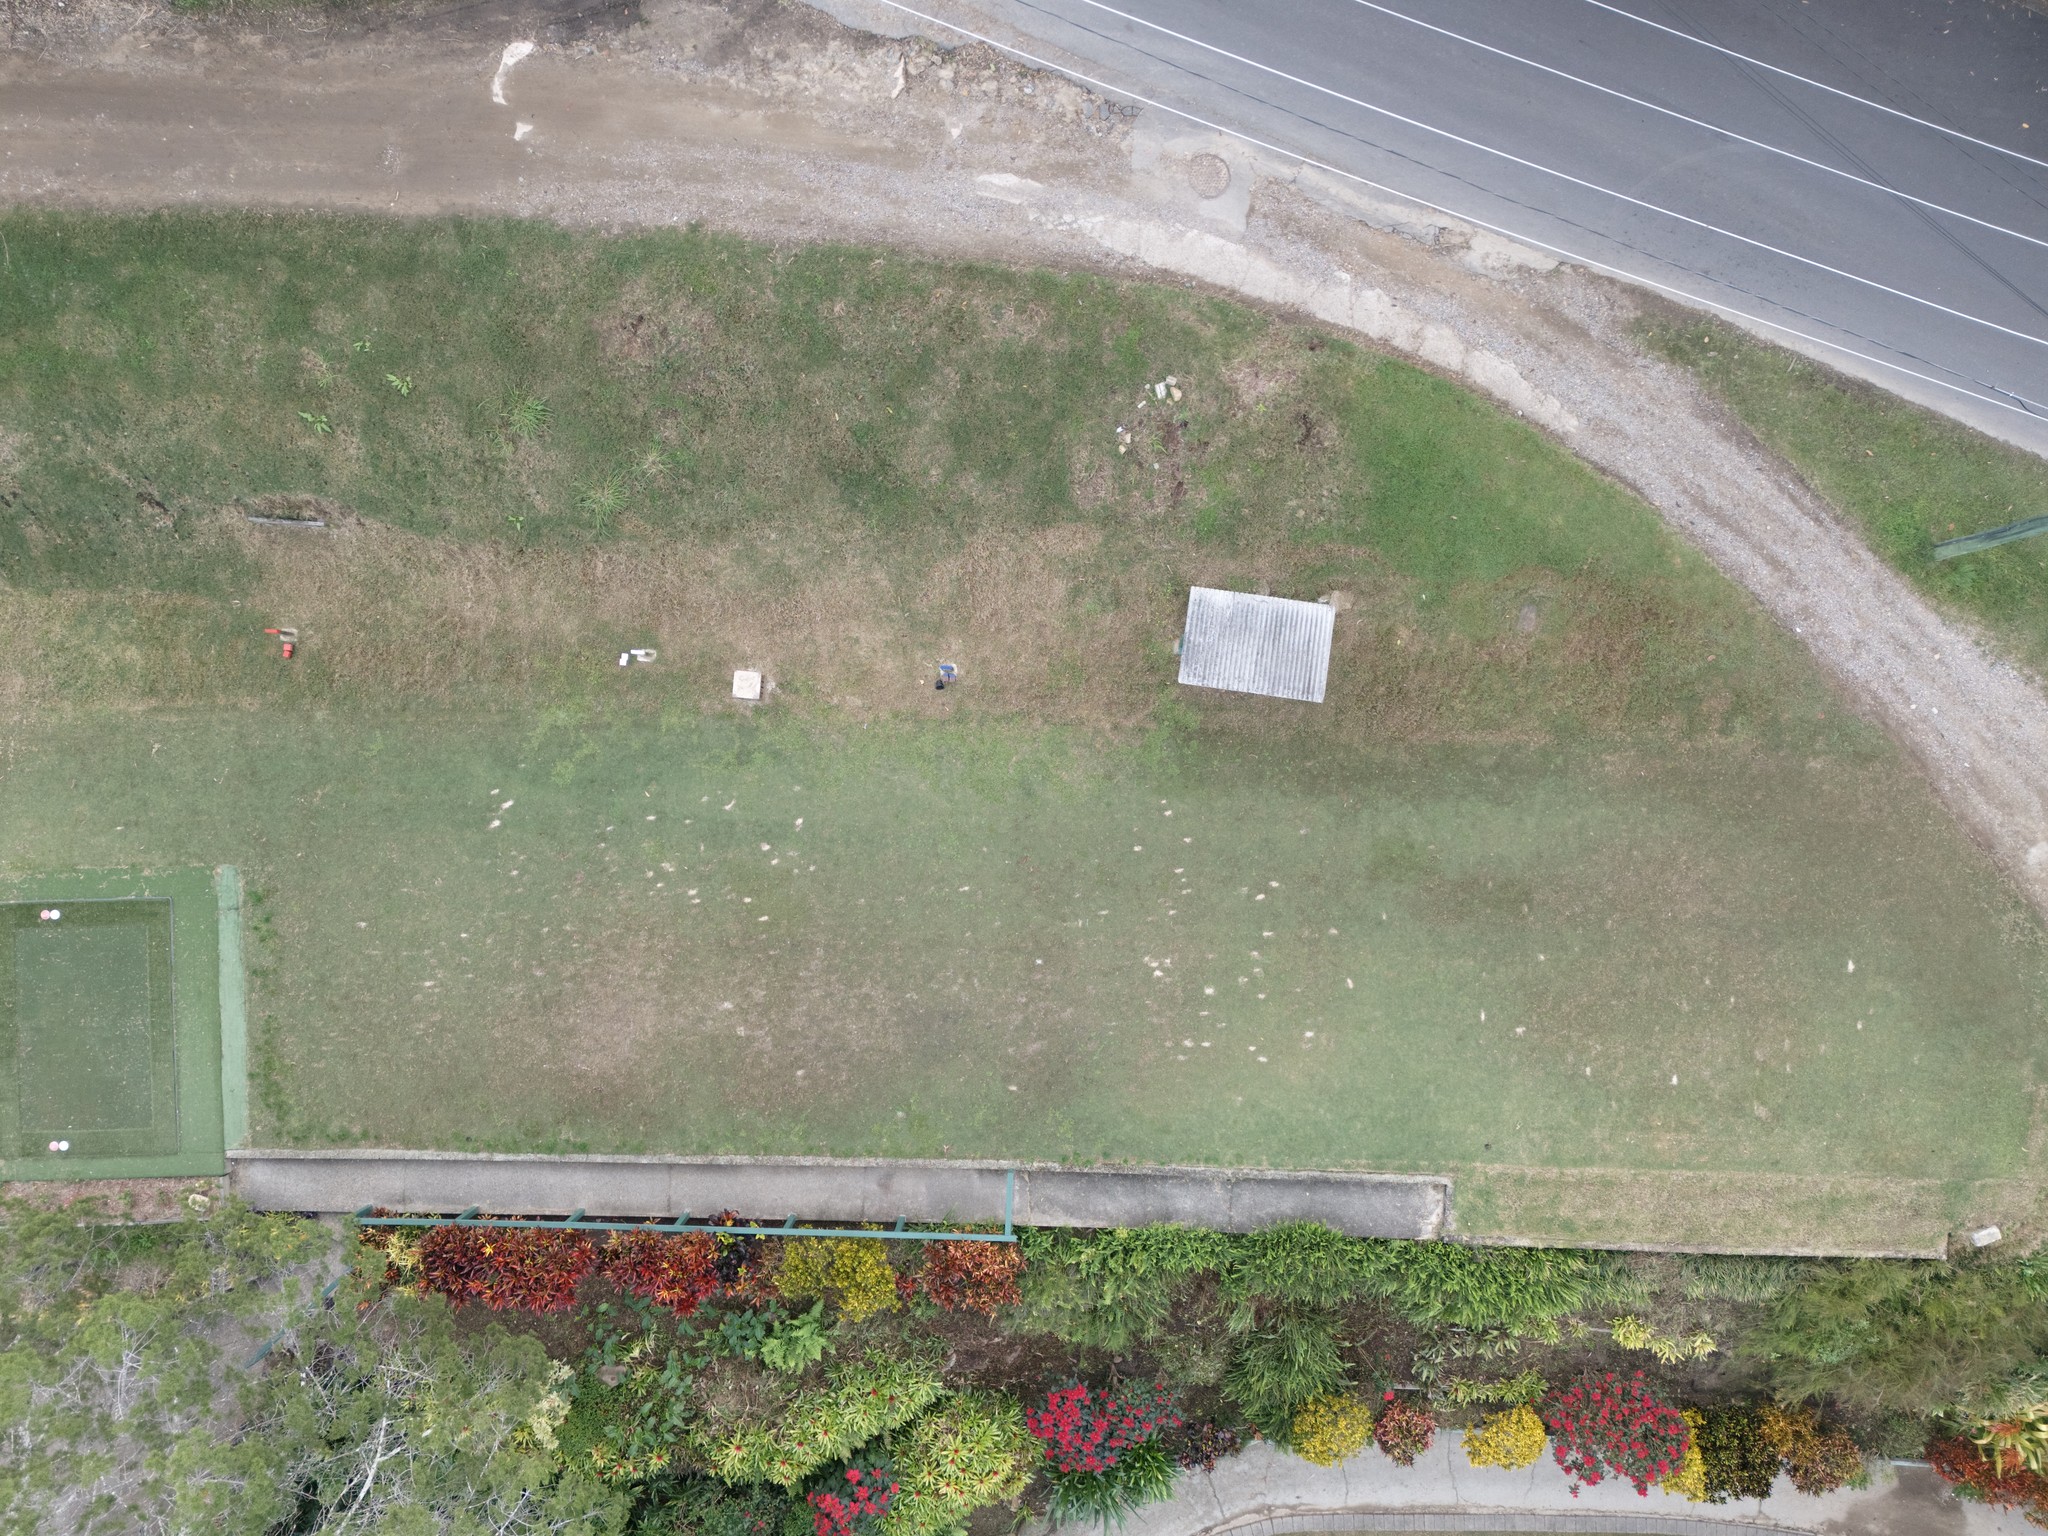
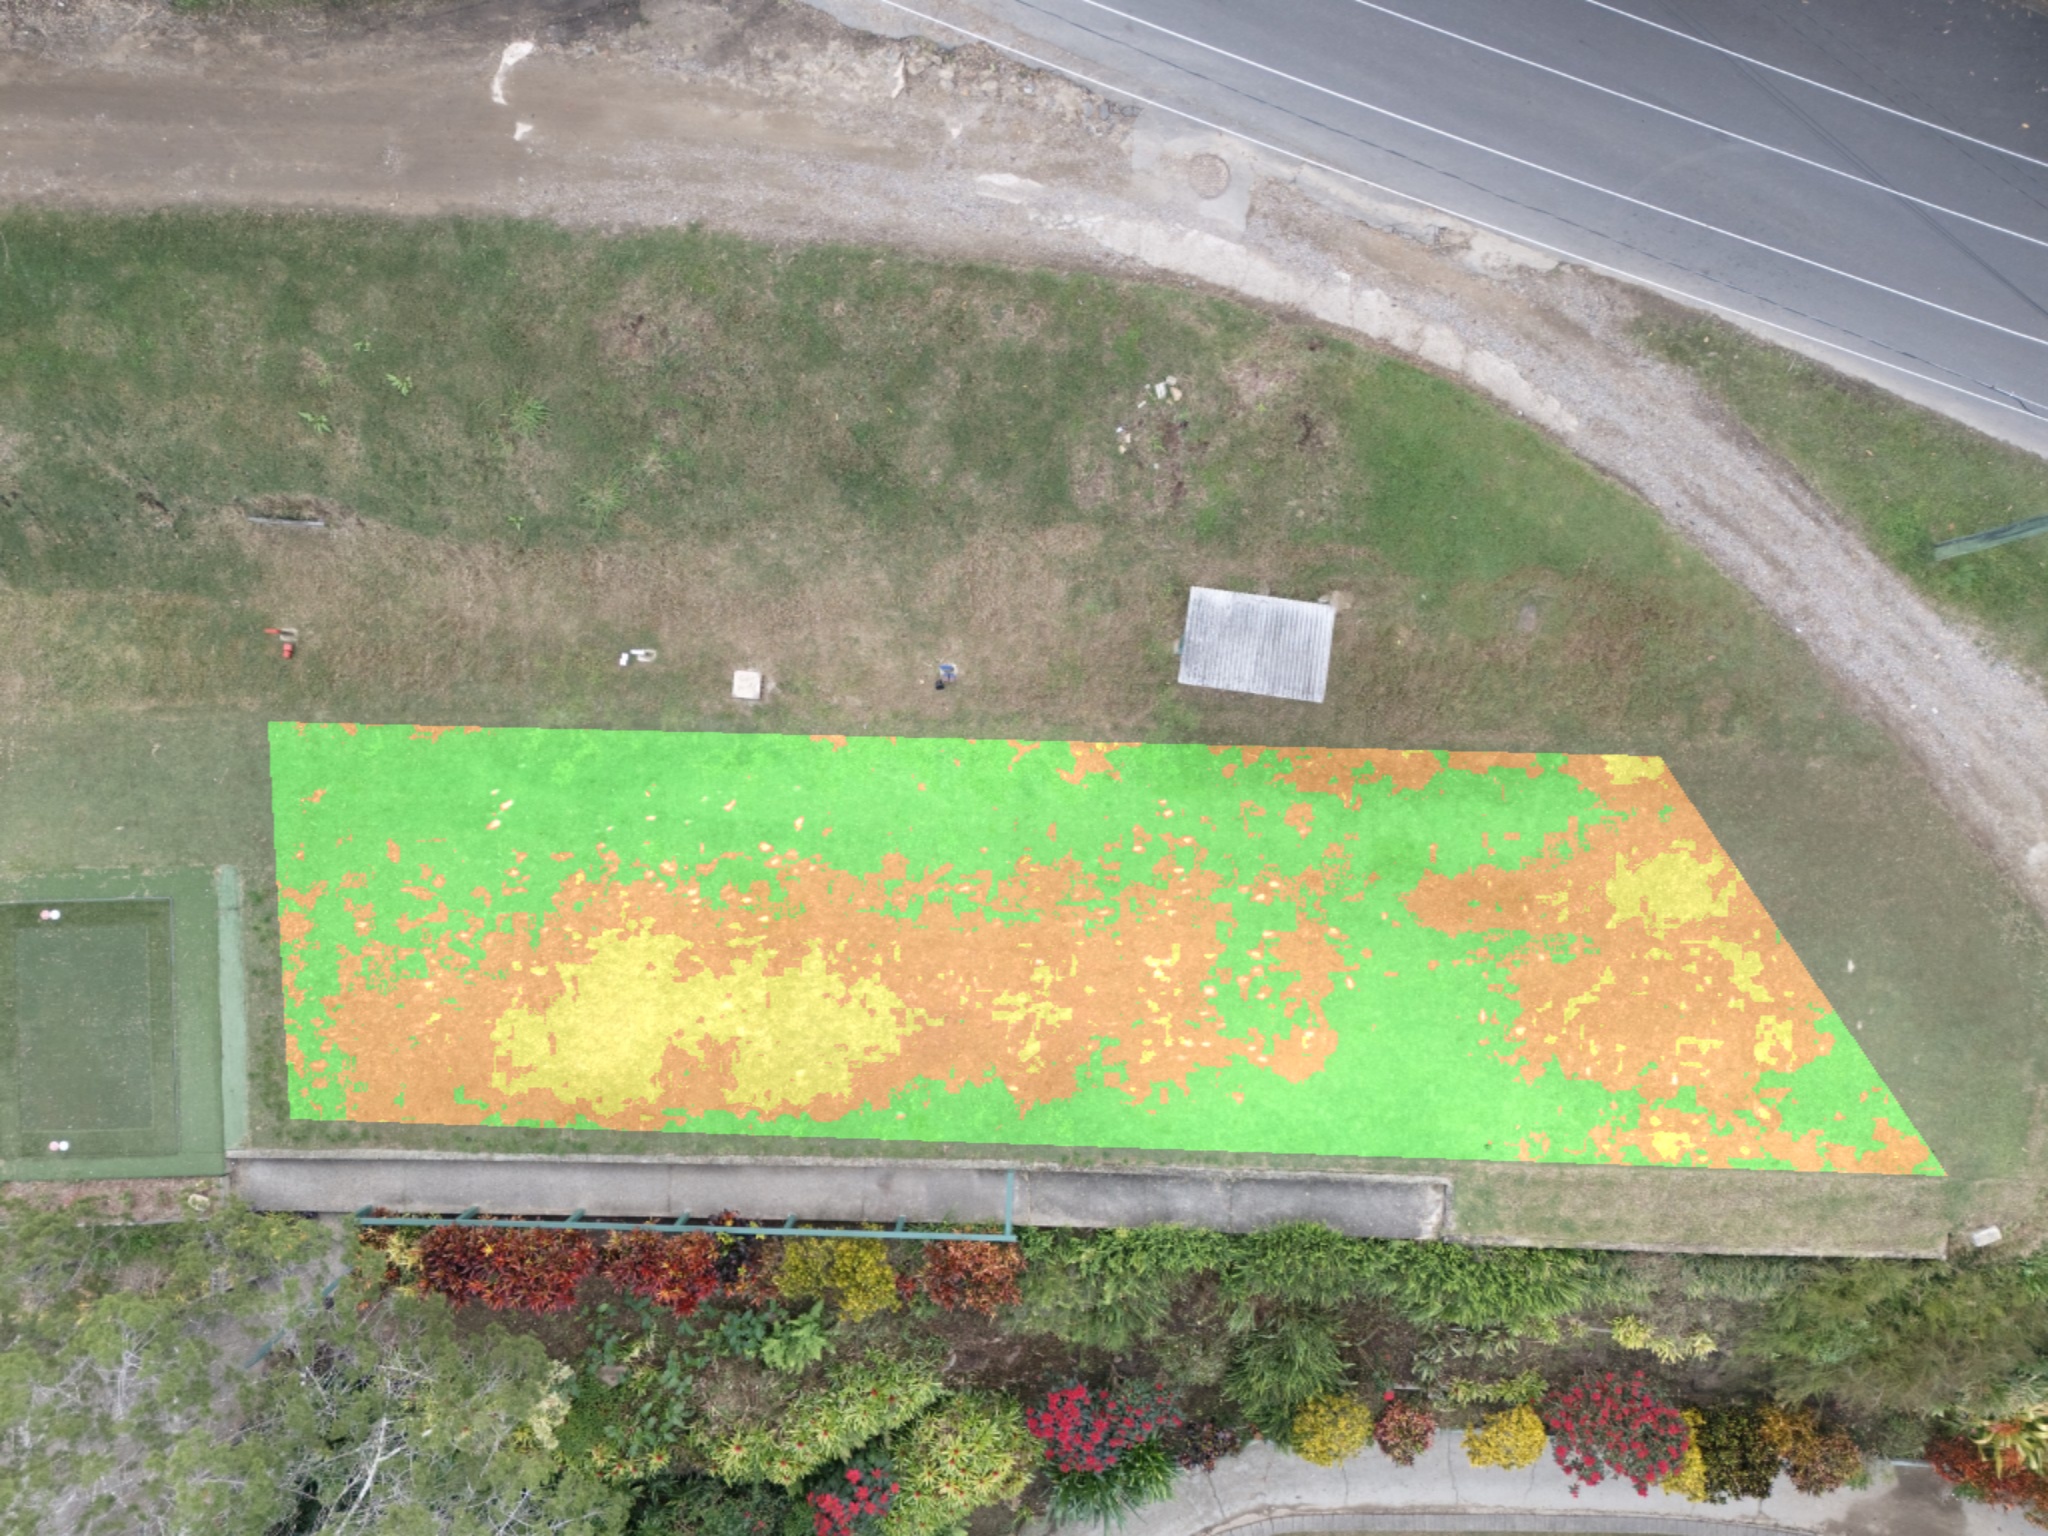
Aerial photo of a golf green Grass Buddy health analysis overlay of the same green Turf Analysis Drag to compare
78

Health Score Green — Hole 7
Healthy Mid Stressed

Currently in use with golf courses across South-East Queensland

100sZones Analysed

Photos in. Health scores out.

Every capture is classified into health and stressed turf.

Drag the slider on any card to compare the original photo with the analysis.

Drone Captures

Aerial overview of greens, fairways and tee boxes from drone flights.

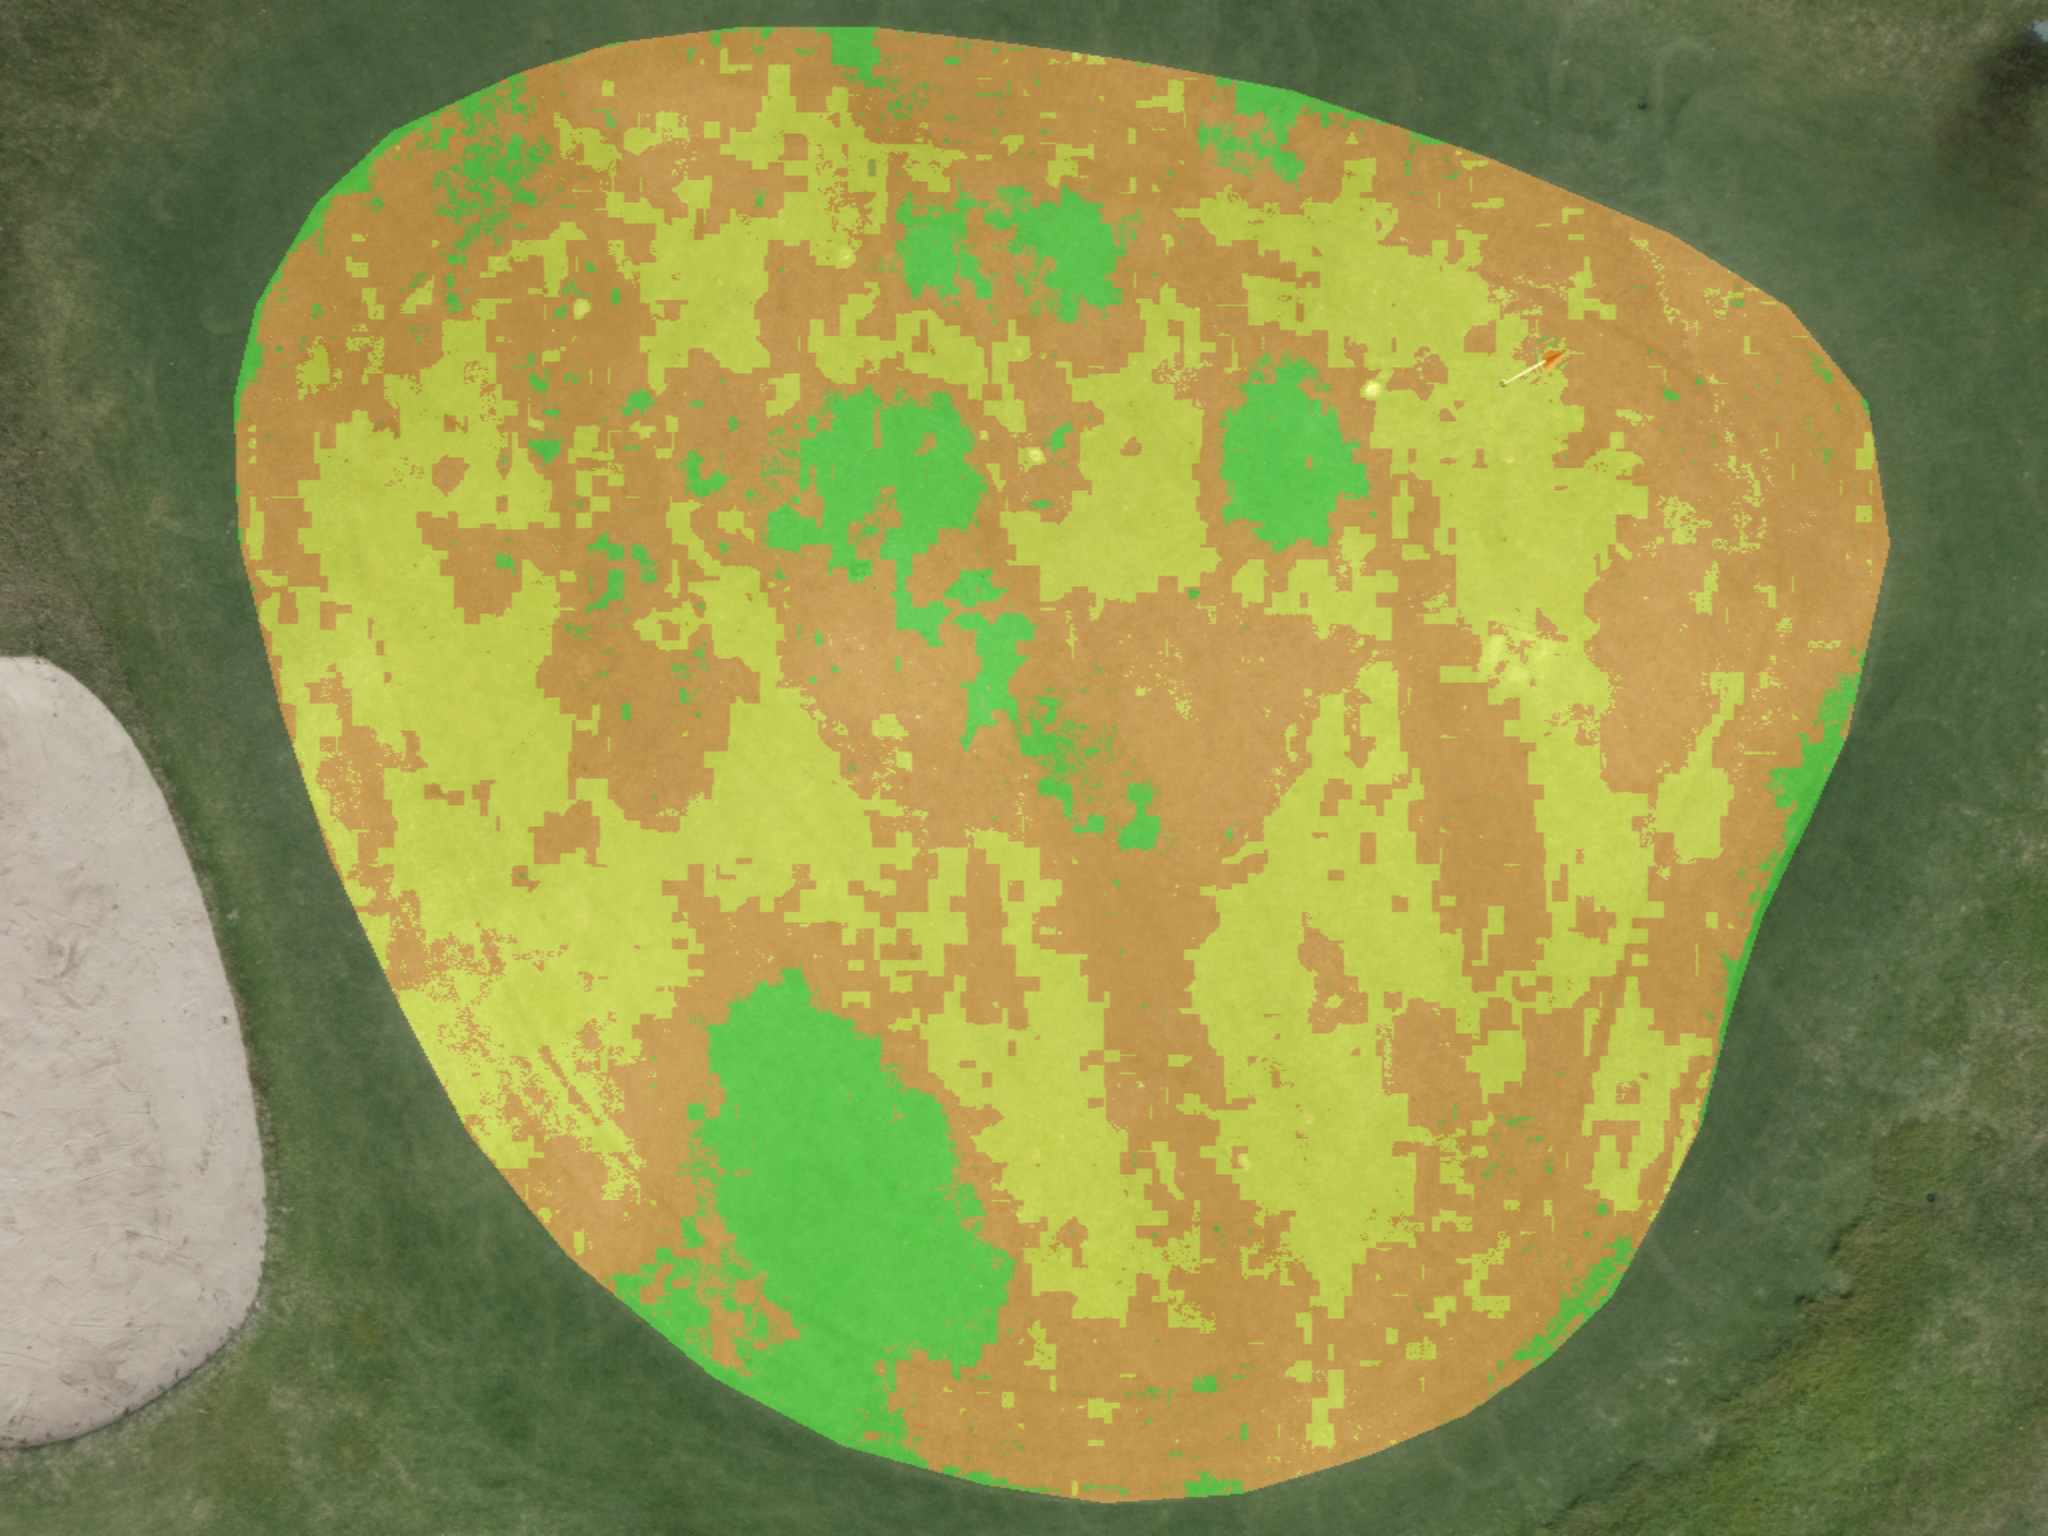
Aerial photo of a putting green Health analysis overlay of the putting green
PhotoAnalysis

Green

Heavy stress across the surface flagged before it becomes visible loss.

Score 48 Healthy Mid Stressed
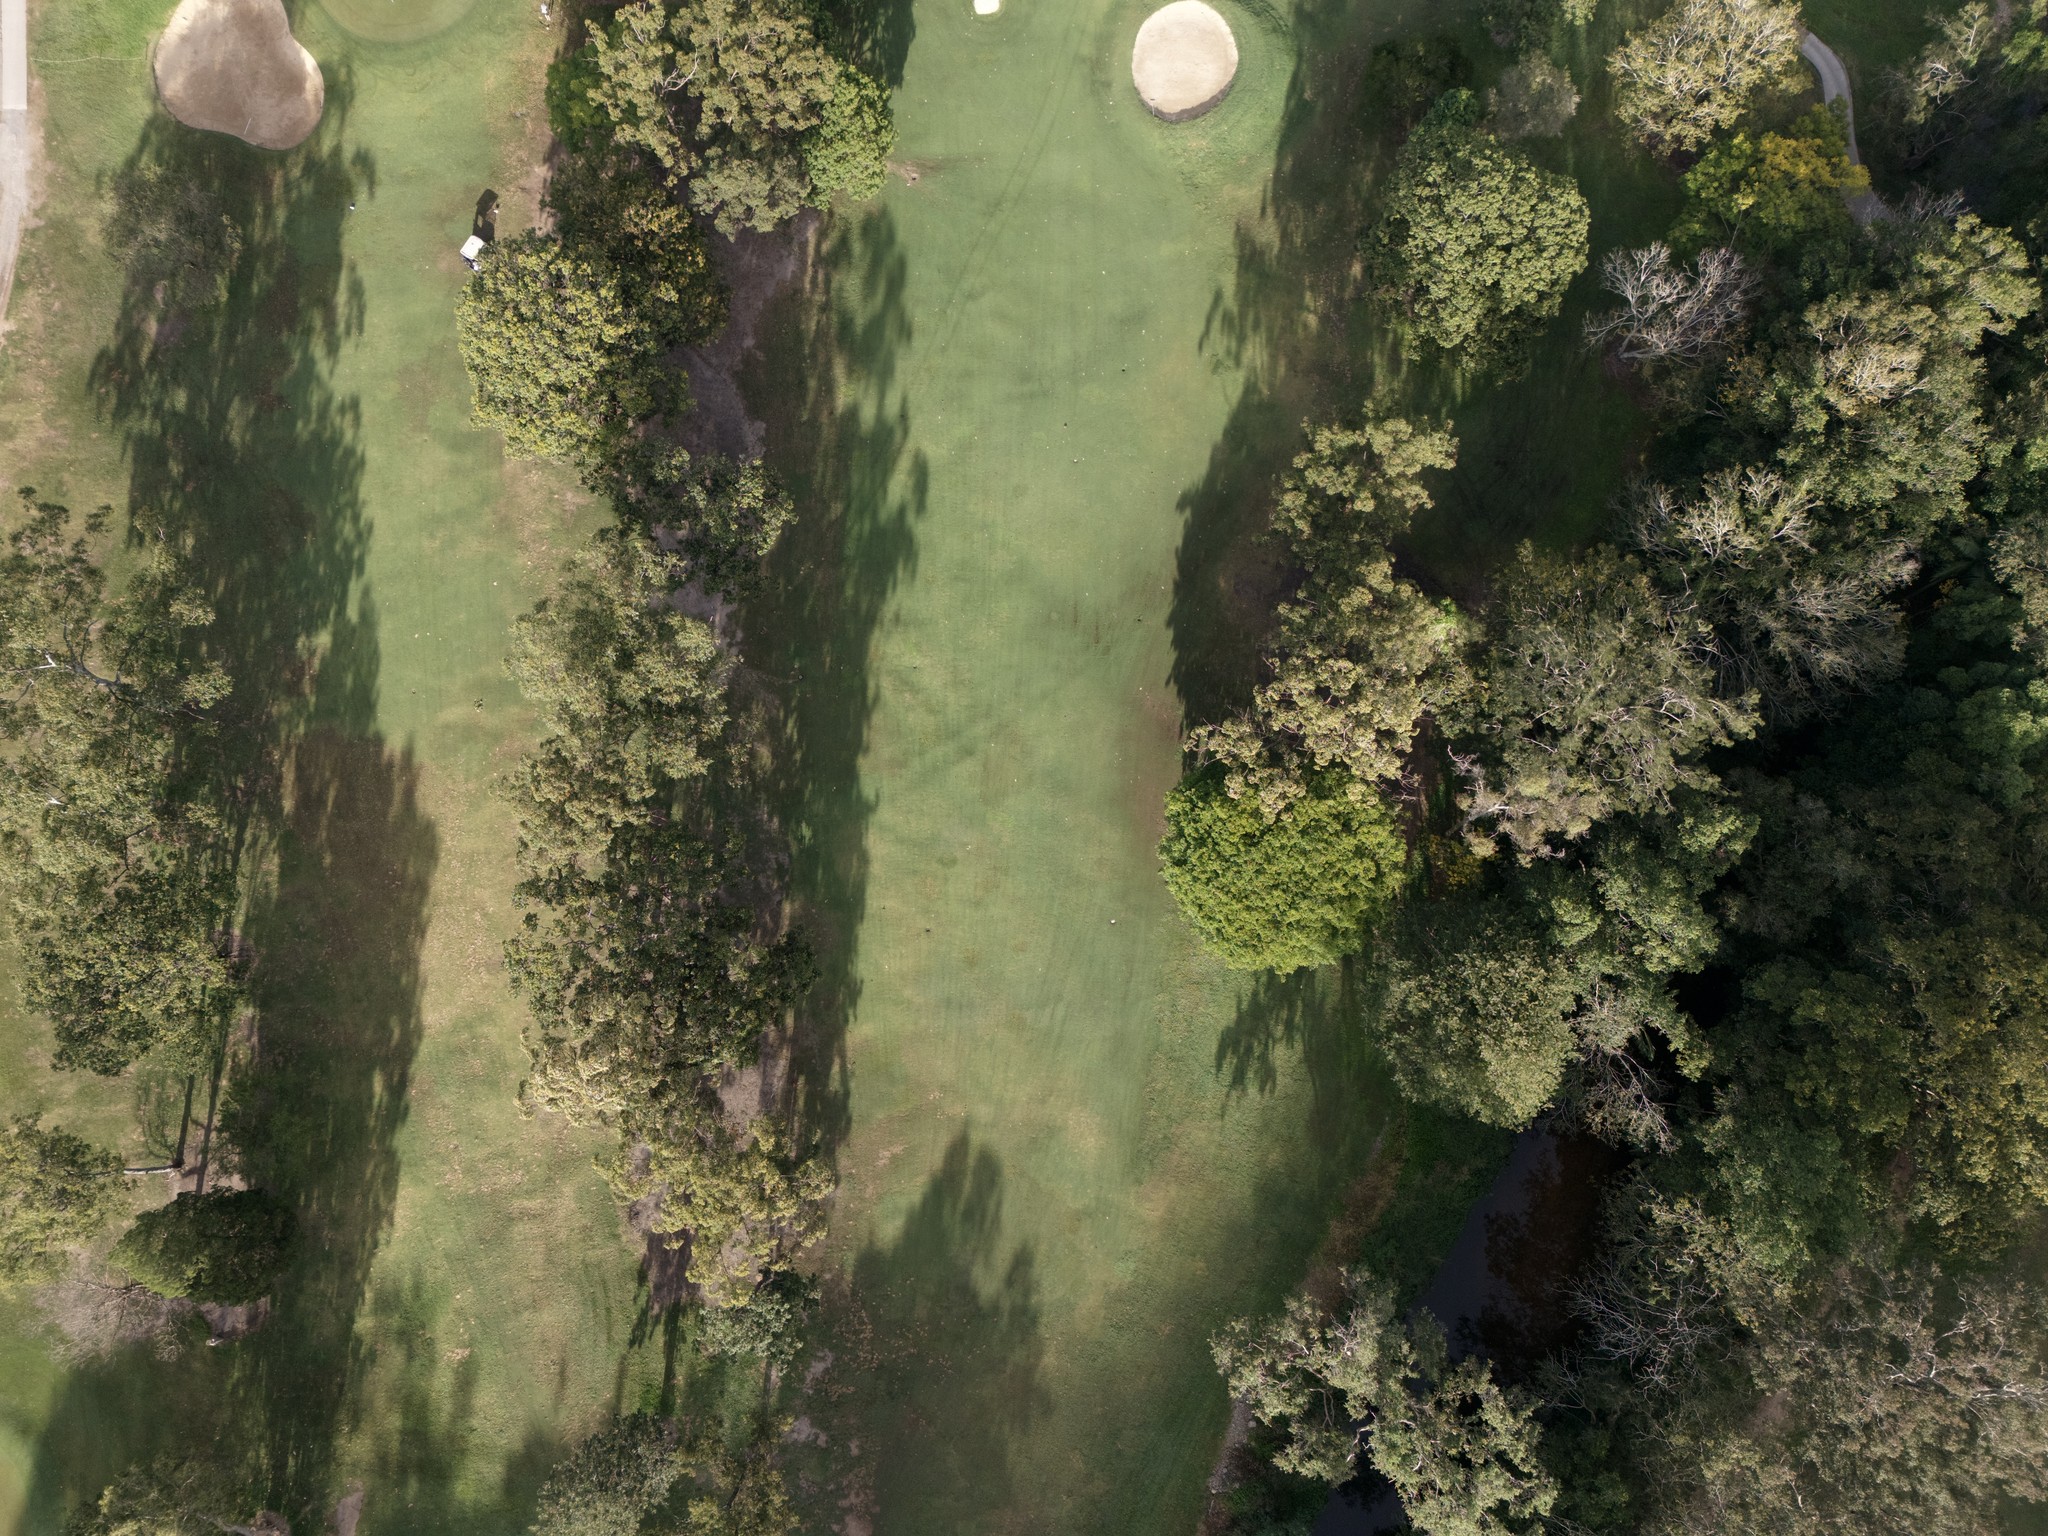
Aerial photo of a fairway Health analysis overlay of the fairway
PhotoAnalysis

Fairway

Shade and traffic wear mapped down the landing zone and approach.

Score 63 Healthy Mid Stressed
Aerial photo of a practice area Health analysis overlay of the practice area
PhotoAnalysis

Tee Box

Even a strong surface reveals early yellowing worth watching.

Score 71 Healthy Mid Stressed

Handheld Captures

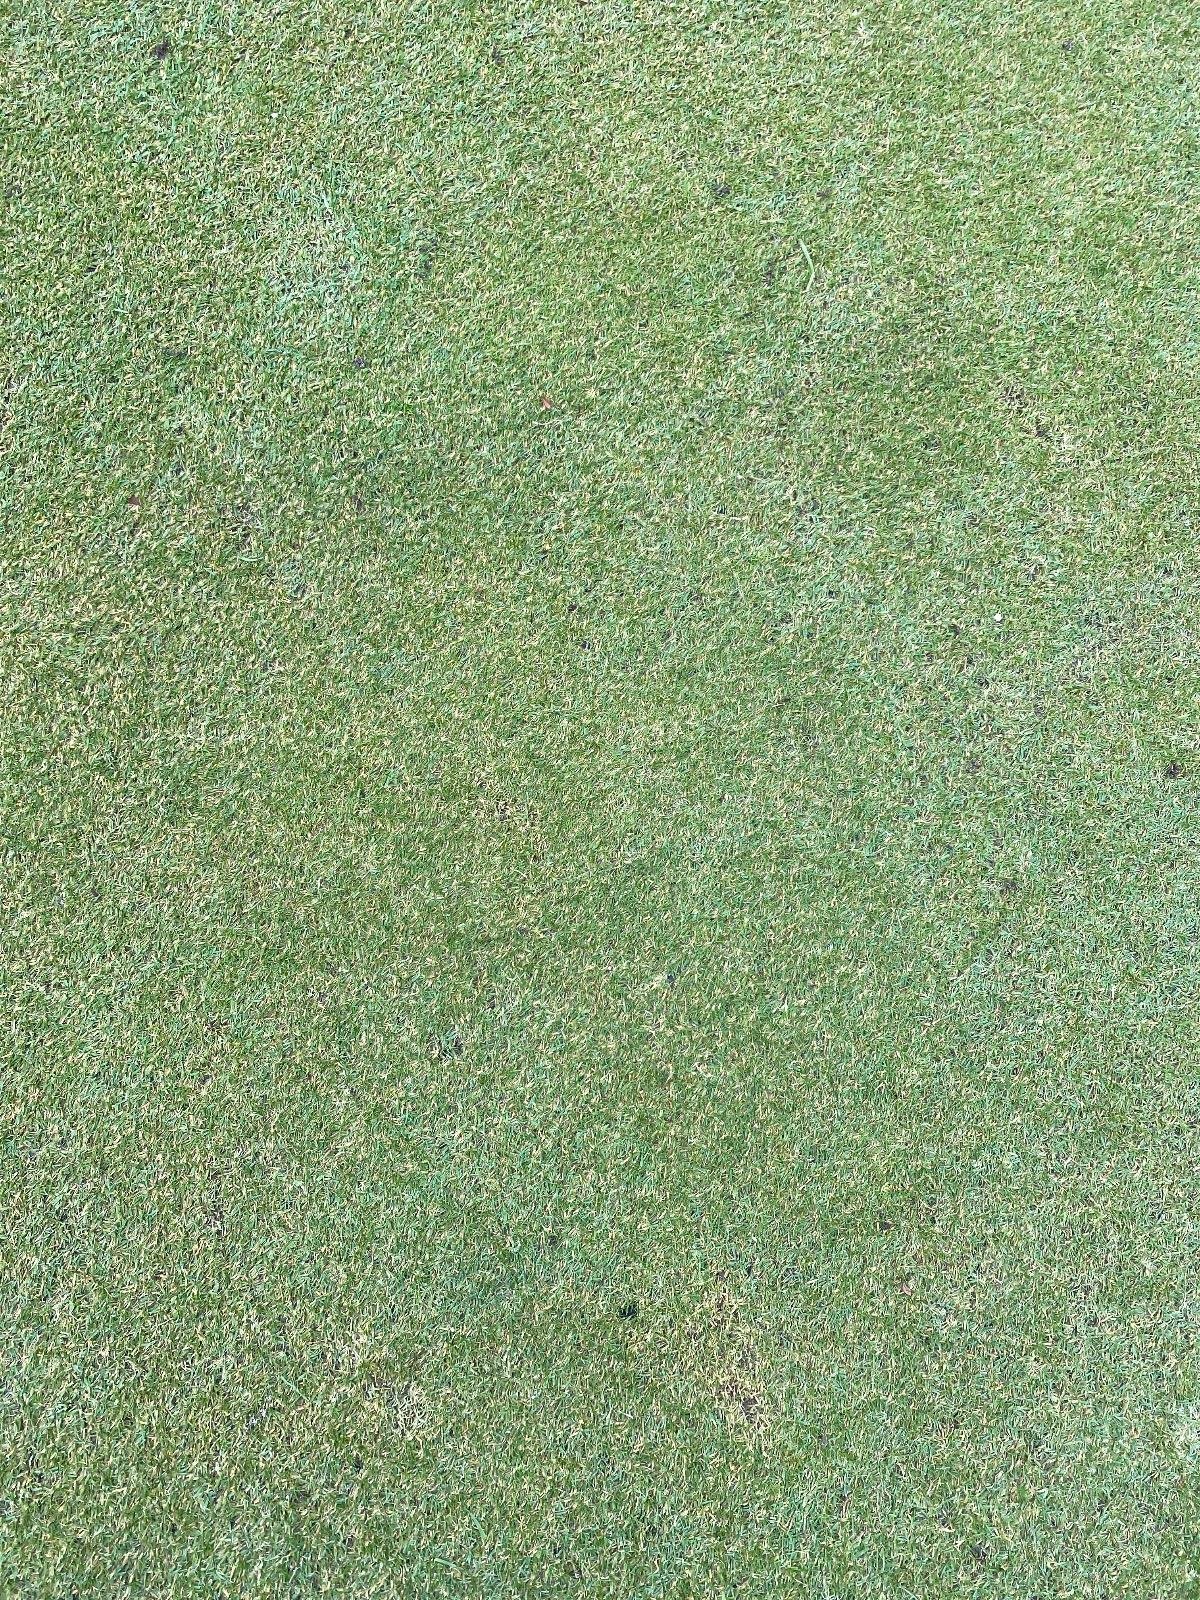
Close-up phone photos for targeted zone-level assessment on the ground.

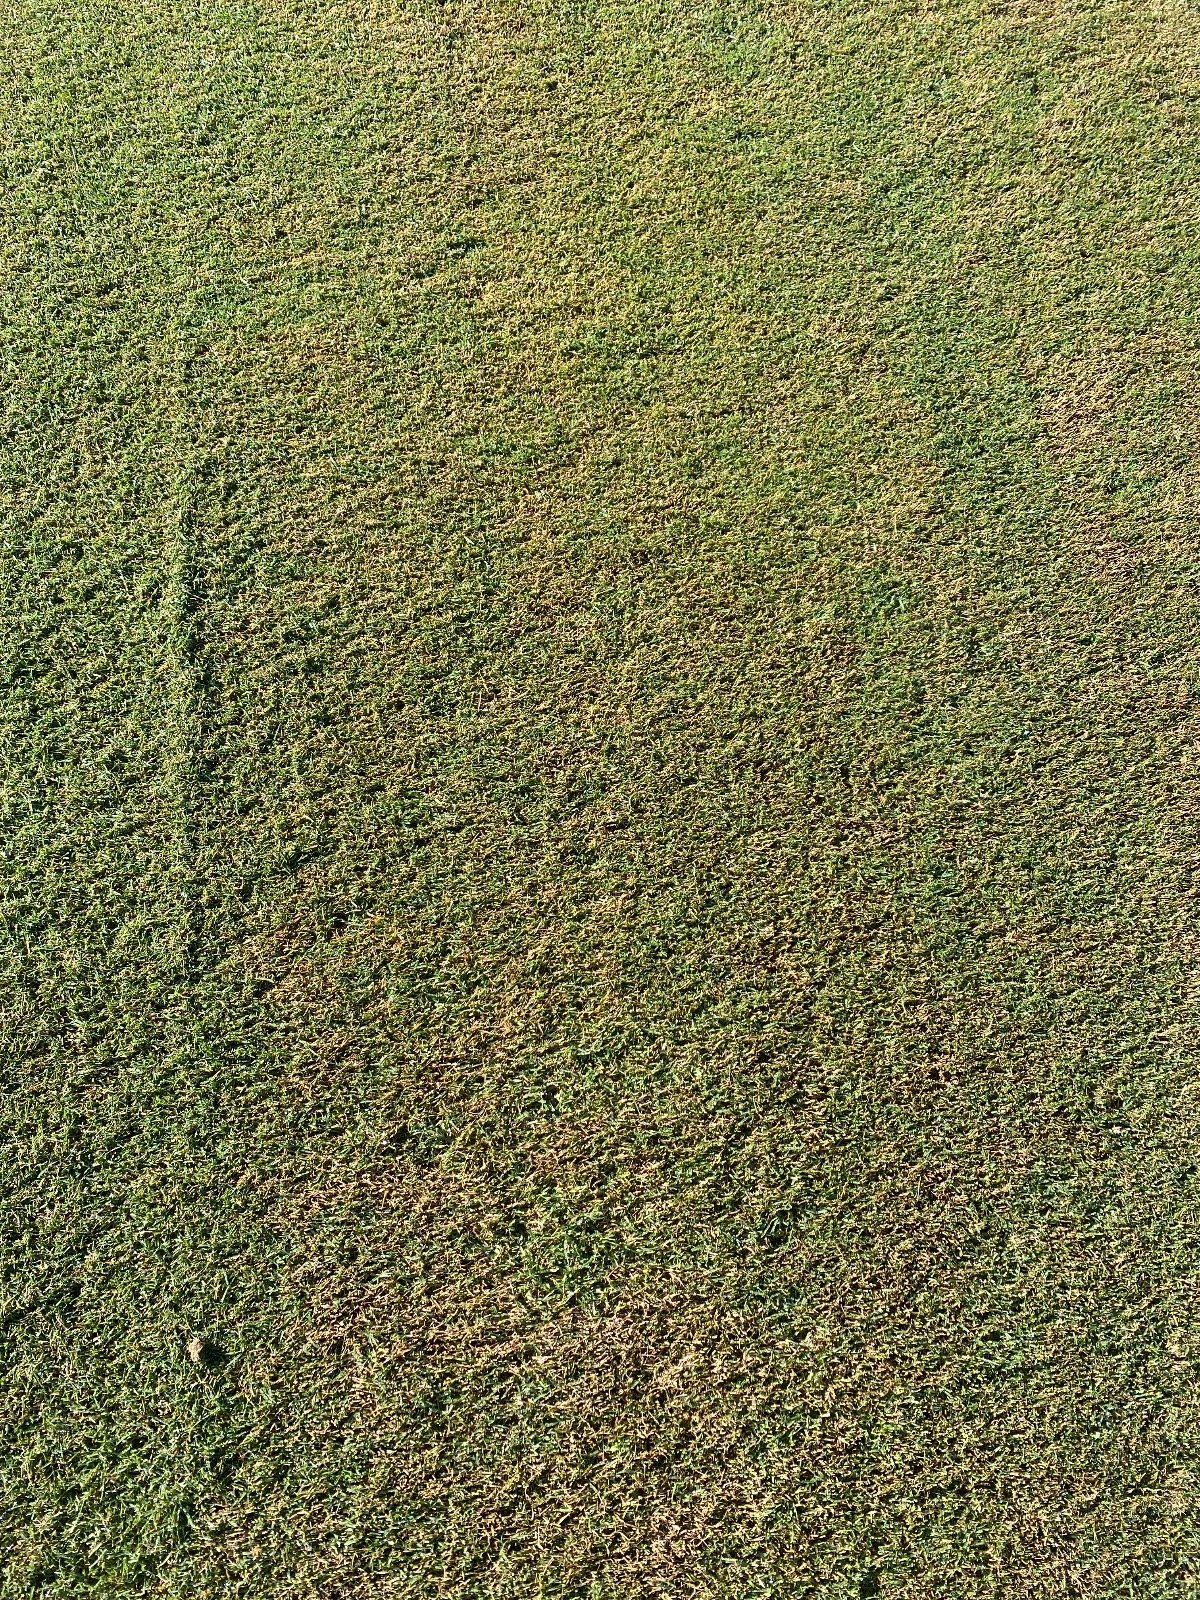
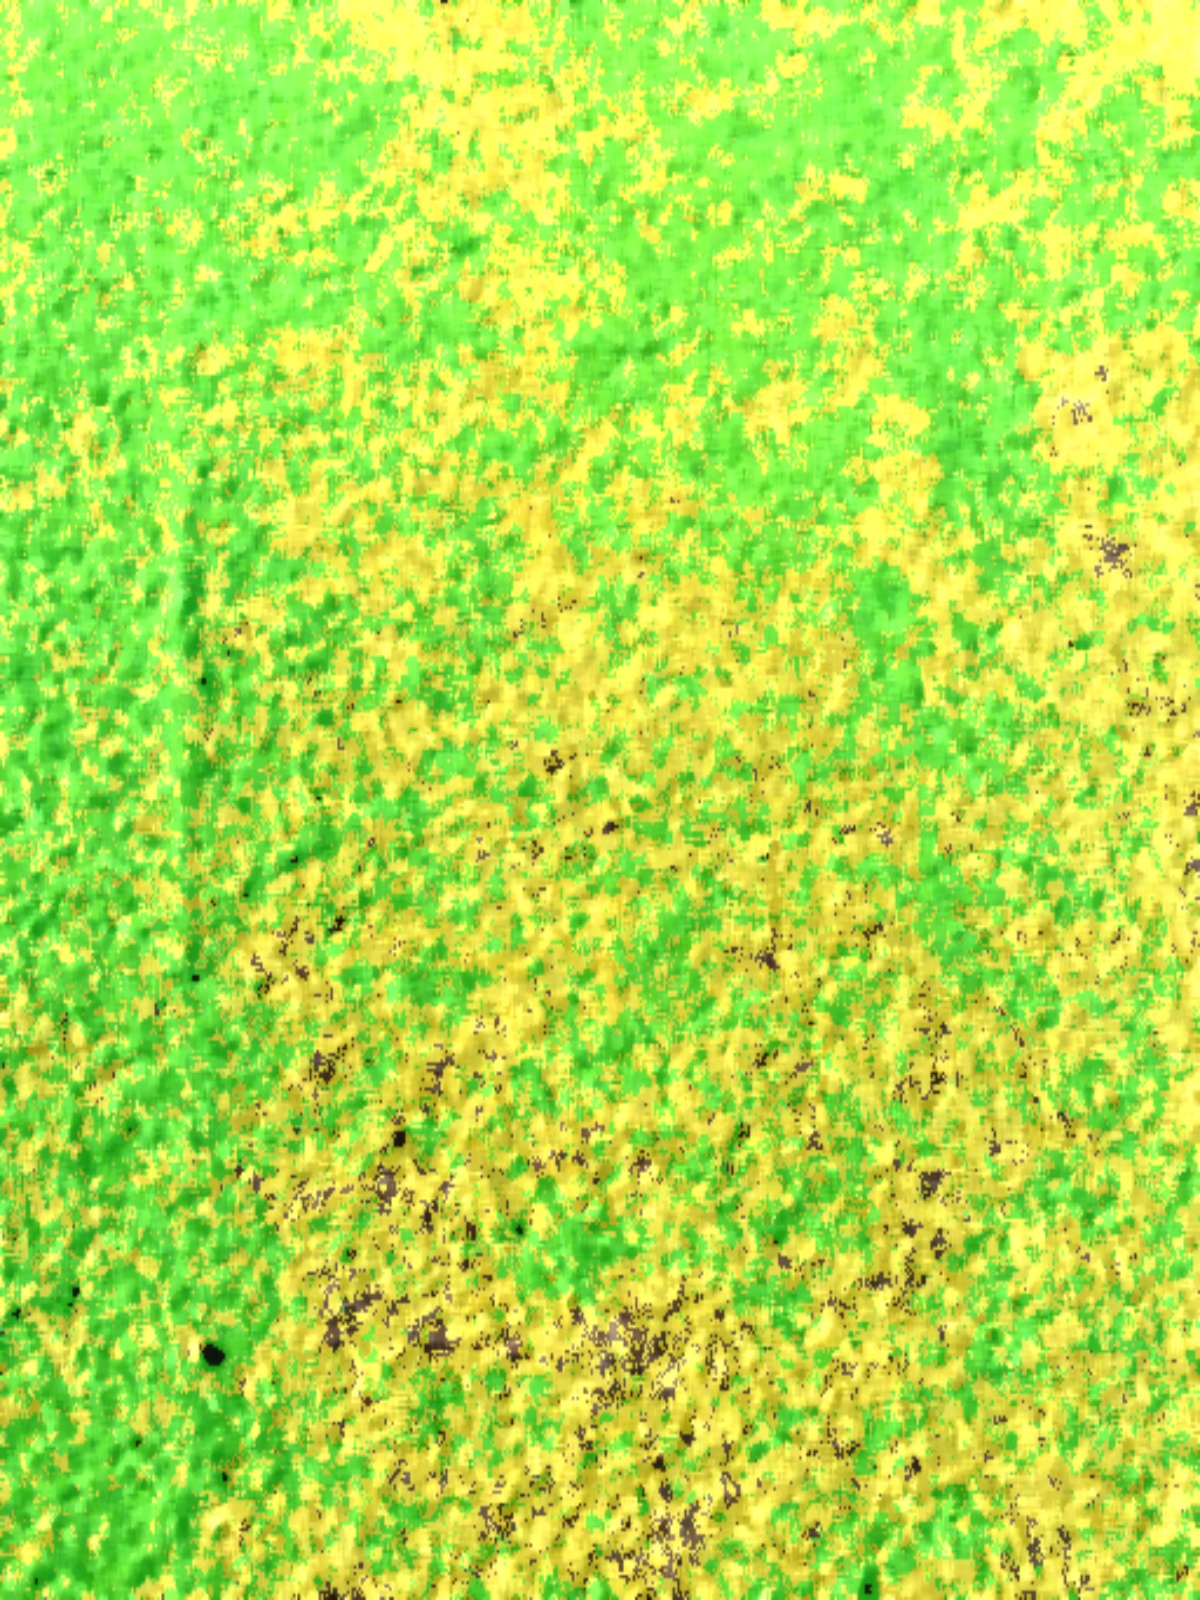
Close-up phone photo of a green Health analysis overlay of the green close-up
PhotoAnalysis

Green

Fine-grained stress detection at turf level — yellowing patches isolated from the healthy canopy.

Score 66 Healthy Mid Stressed
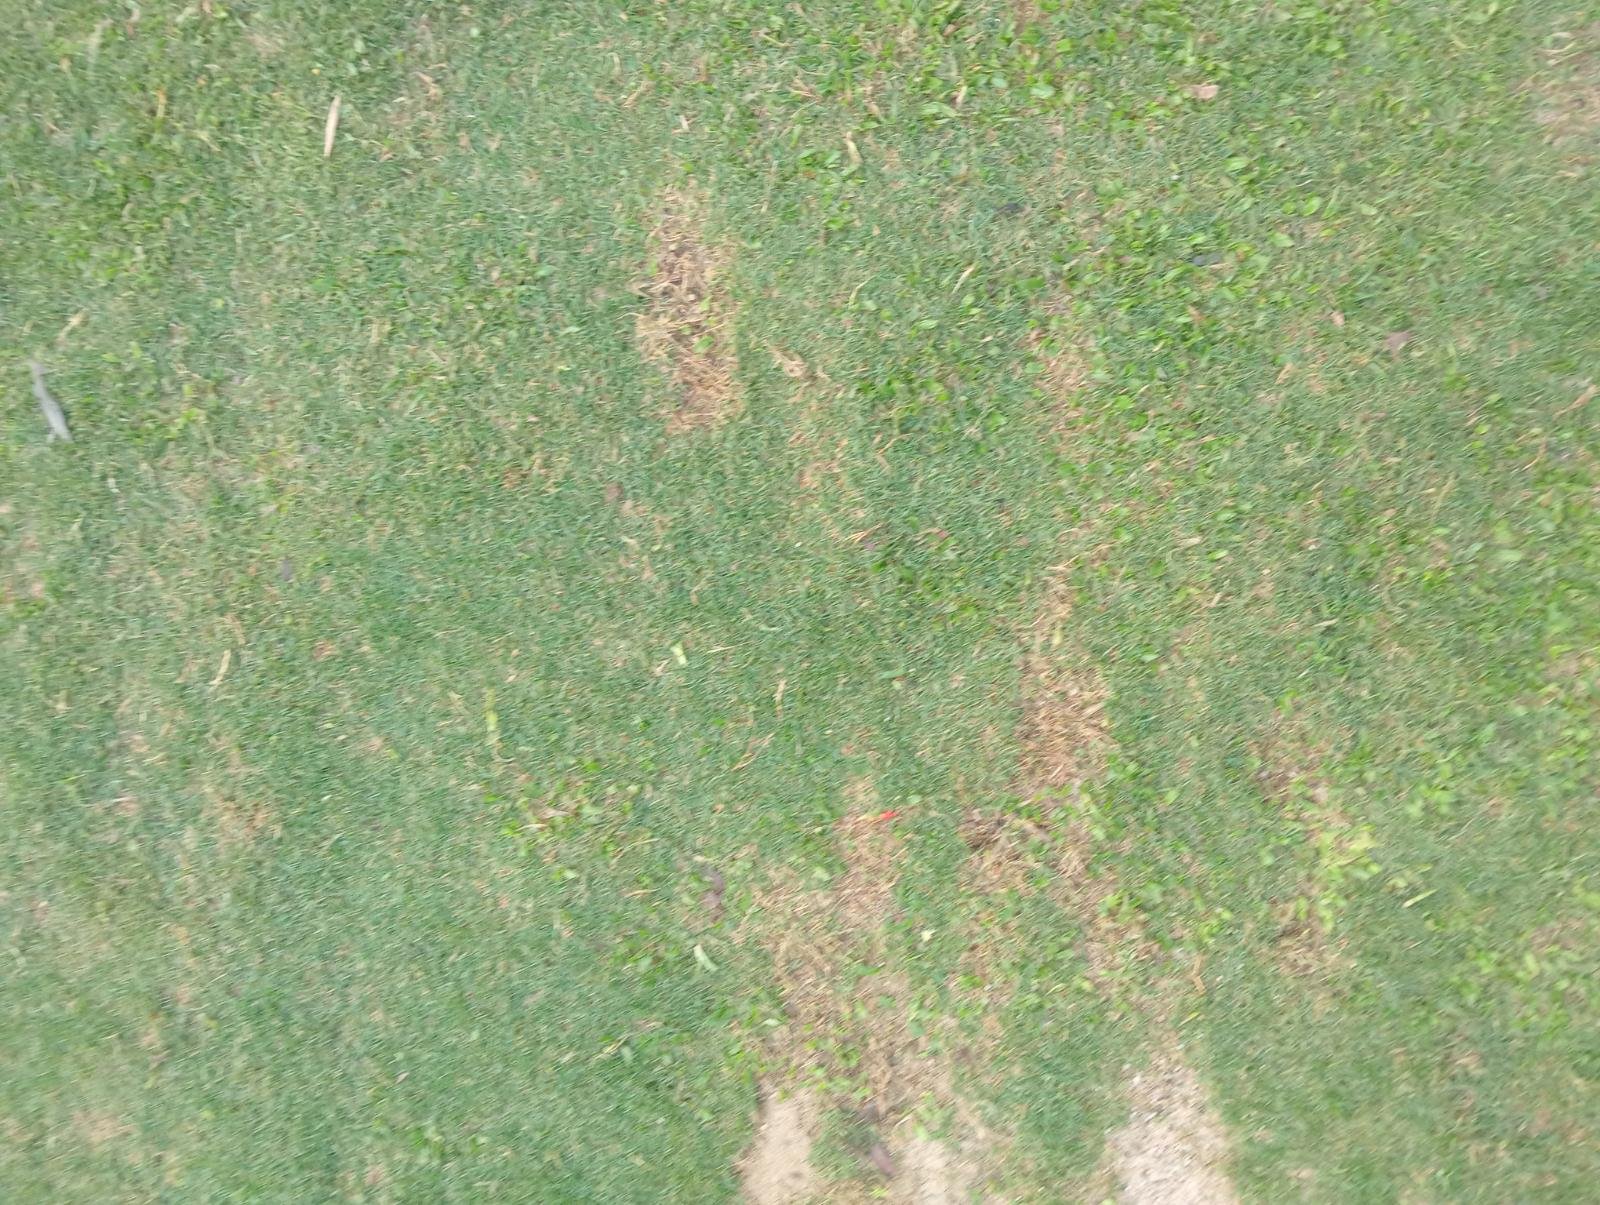
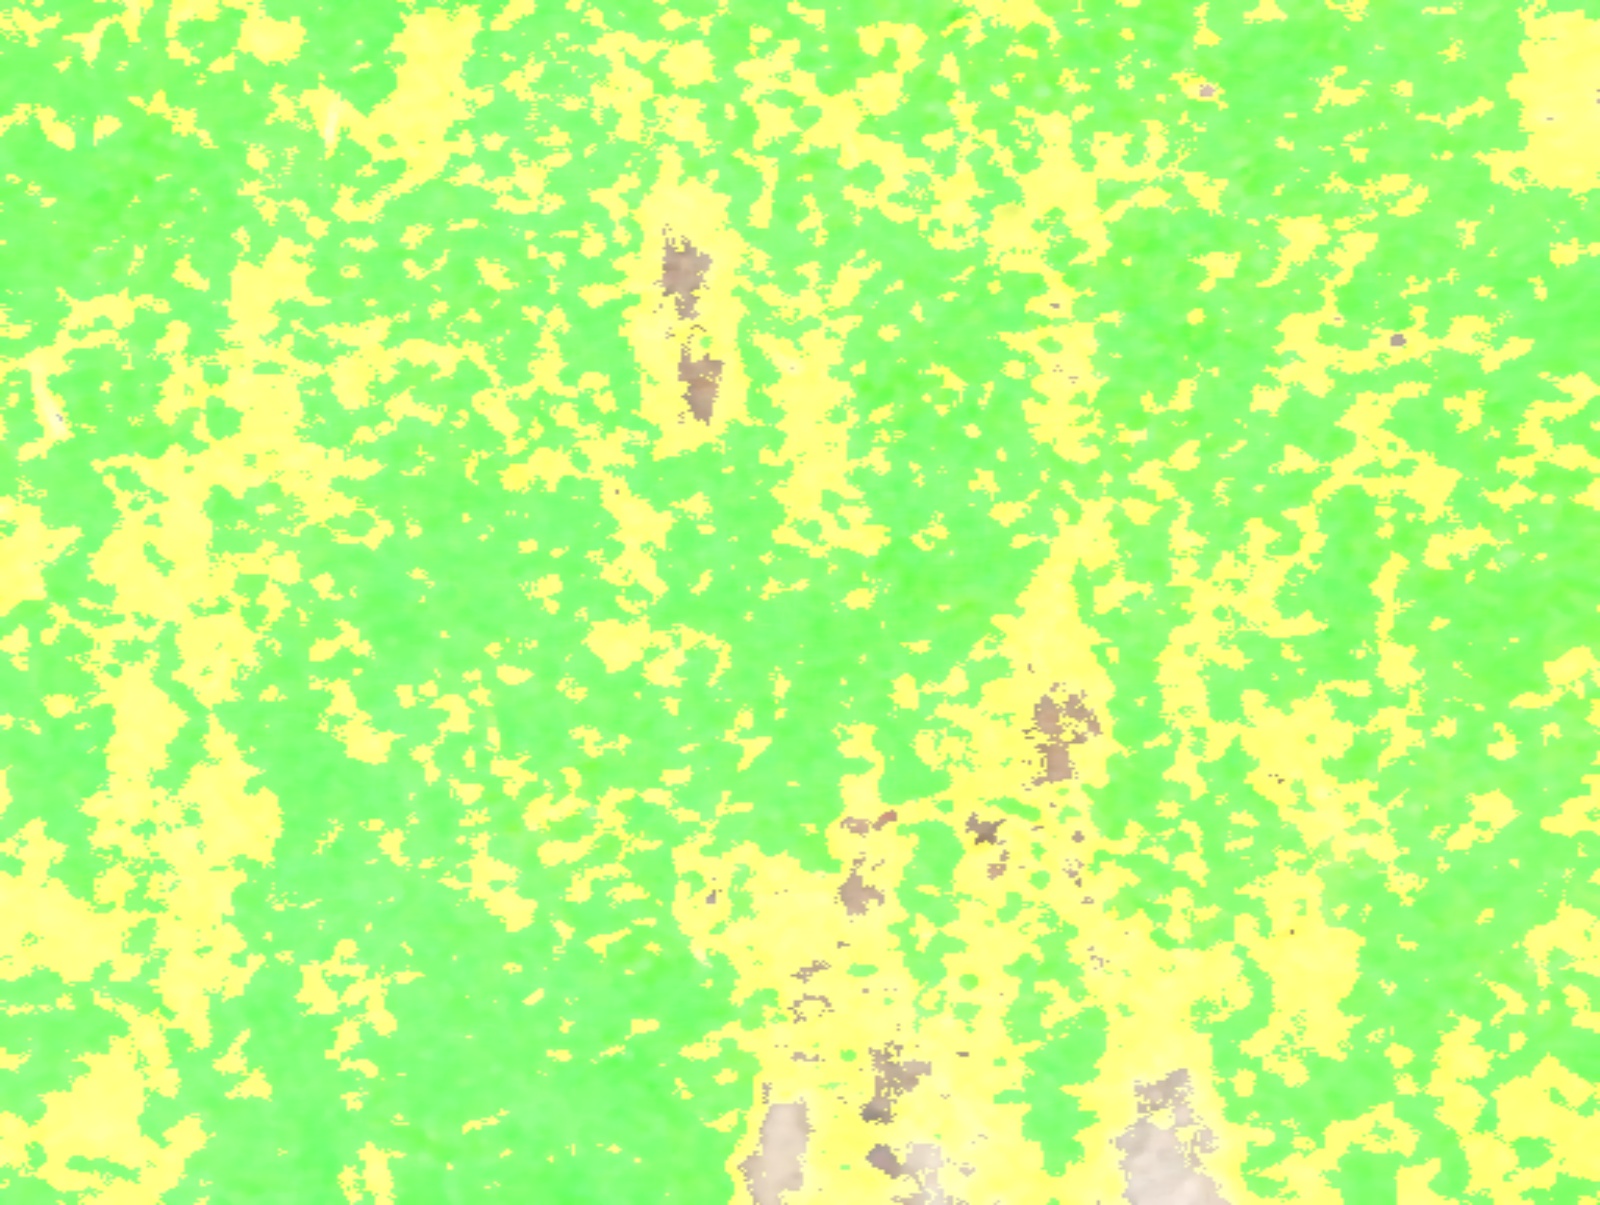
Close-up phone photo of a fairway Health analysis overlay of the fairway close-up
PhotoAnalysis

Fairway

Ground-level view picks up wear bands and dry patches invisible from above.

Score 52 Healthy Mid Stressed
Close-up phone photo of a tee box Health analysis overlay of the tee box close-up
PhotoAnalysis

Tee Box

Divot damage and bare patches mapped at close range — track recovery between mowing cycles.

Score 47 Healthy Mid Stressed

Real captures and analysis from Grass Buddy pilot courses. Scores shown are representative example outputs.

Data-driven turf intelligence
built for the course

Capture, analyse, and act directly from the course. Replace guesswork with a consistent, quantified visual record of your course's condition.

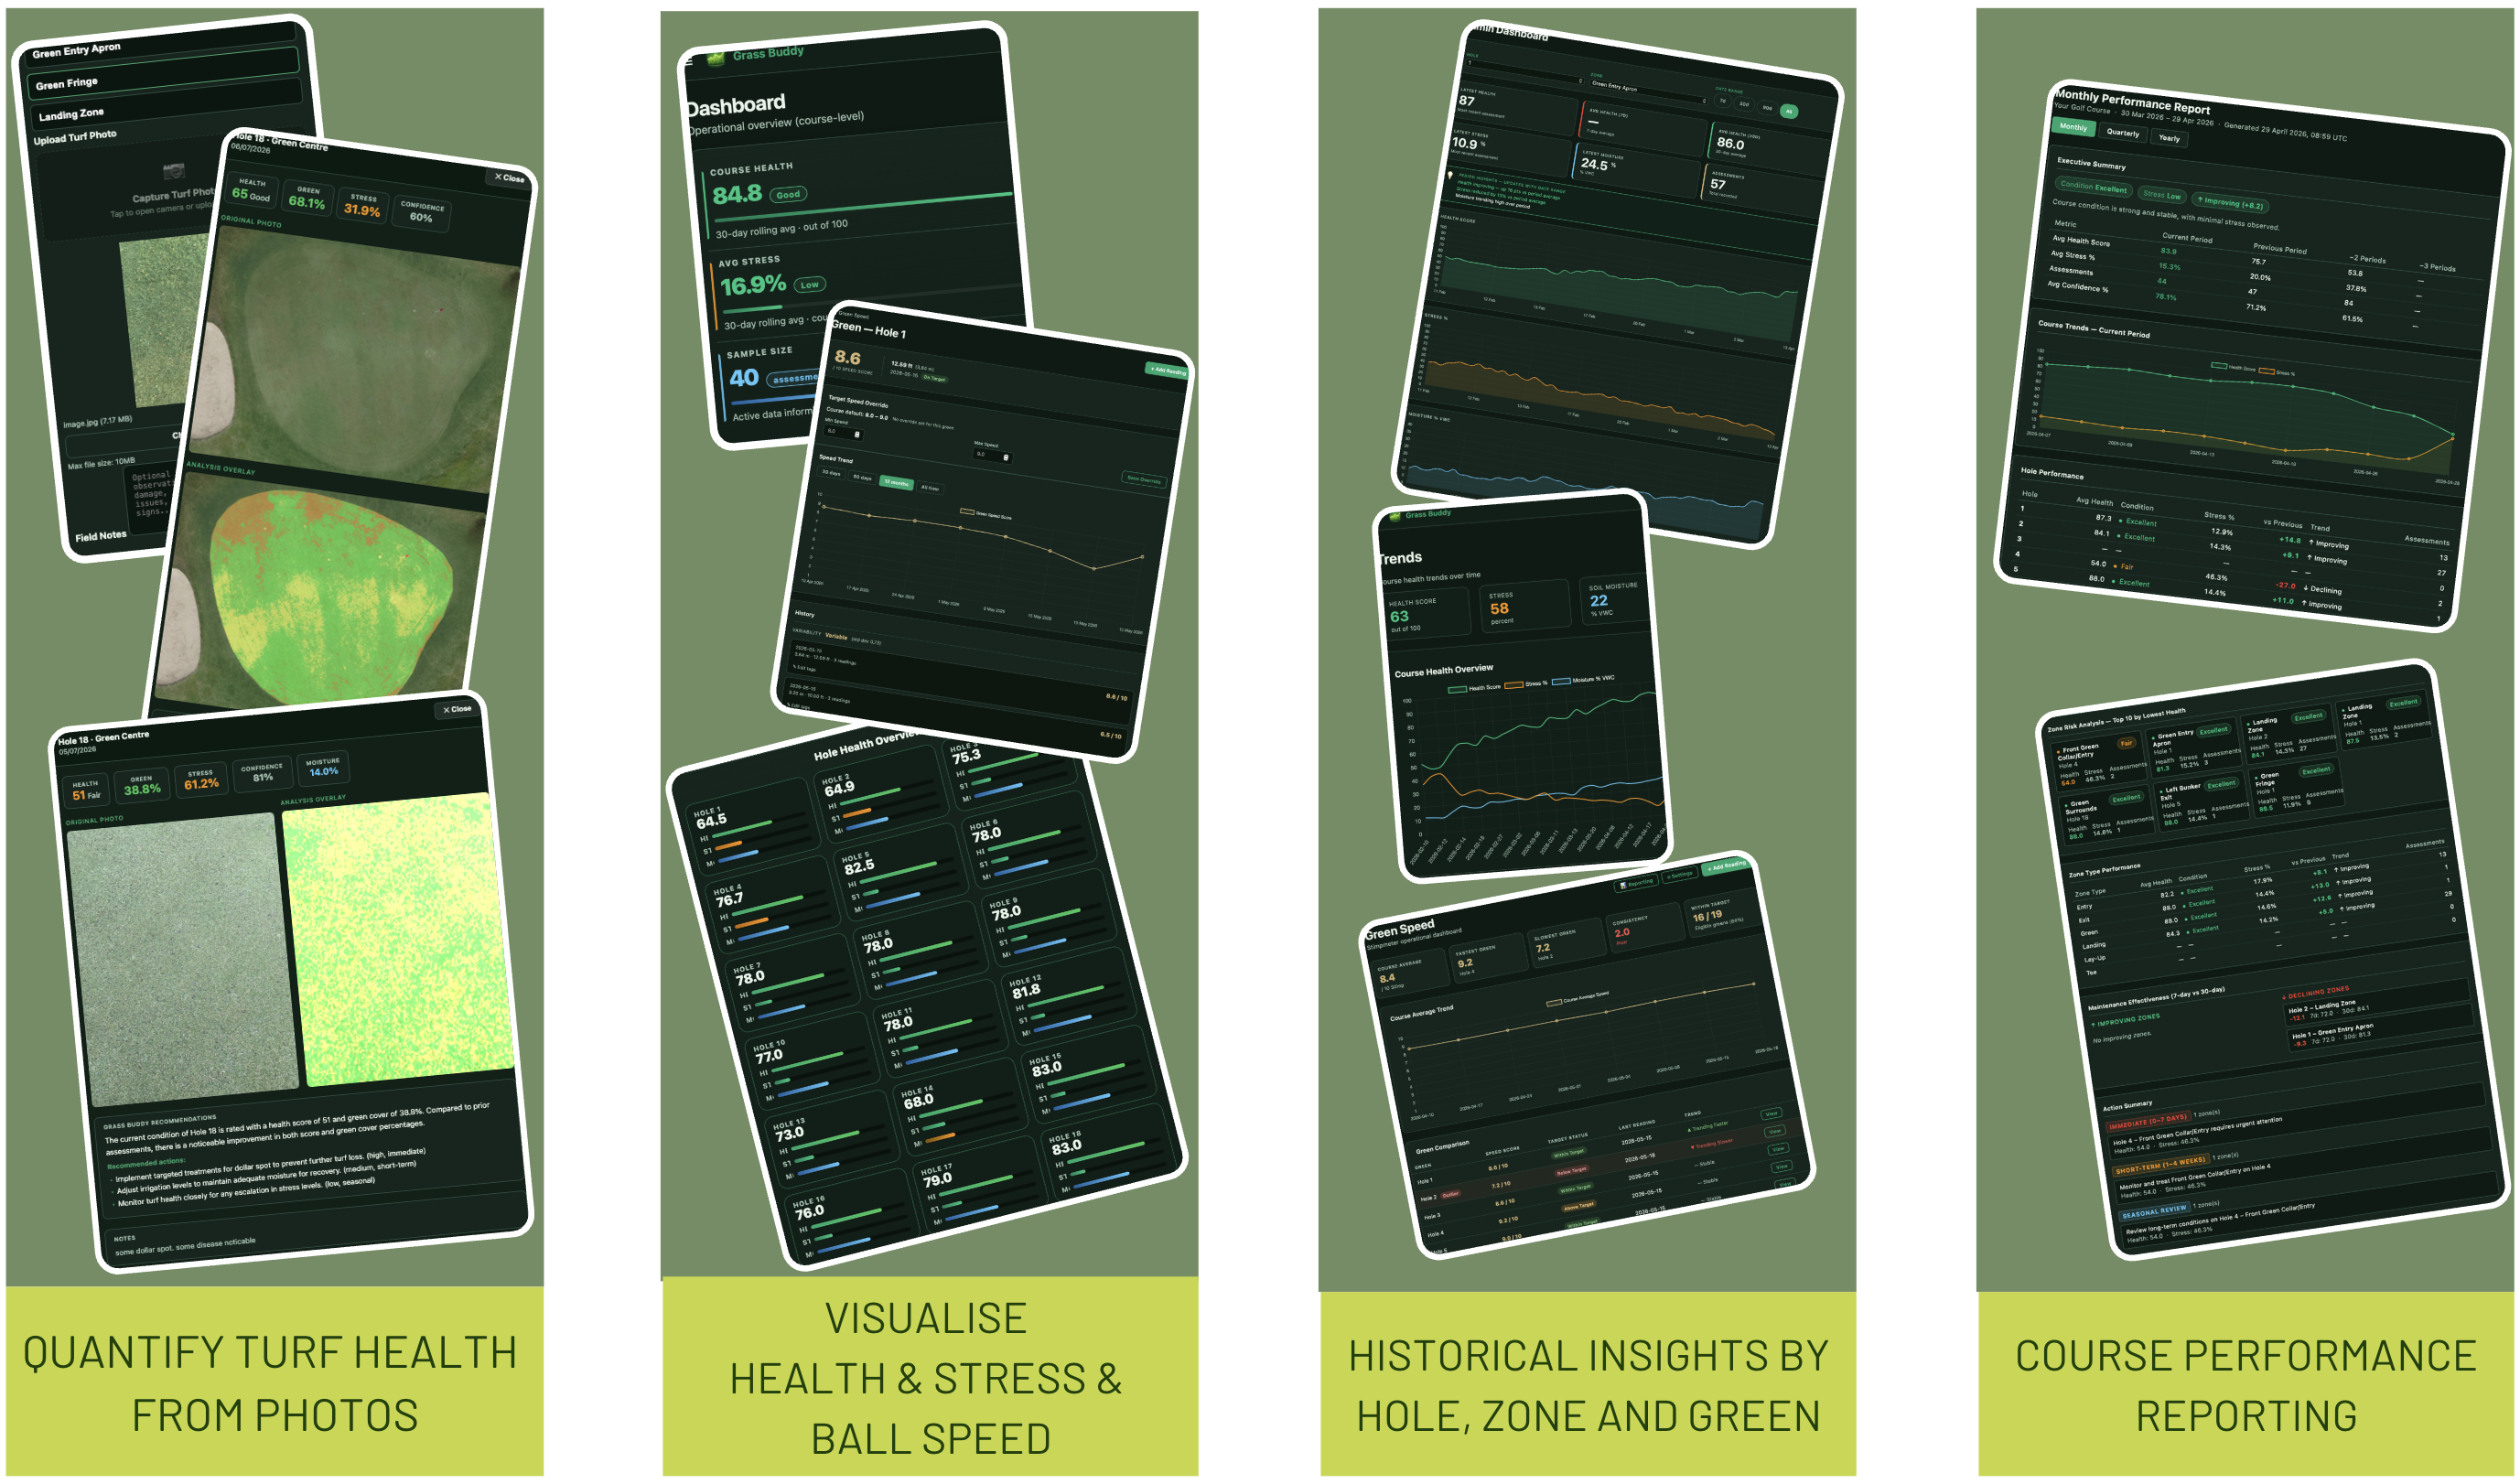
Quantify Turf Health

Turn a phone or drone photo into a scored assessment — healthy and stress percentages calculated instantly. No lab. No delay.

Visualise Health & Stress

Colour-overlaid analysis images alongside live dashboards showing course health scores and stress percentages at a glance.

Historical Insights

Track trends by hole, wear zone, and green type. Recovery and decline patterns become visible across weeks and seasons.

Course Performance Reports

Monthly reports across all holes and zones. Share with management, document decisions, and support budget conversations with evidence.

Moisture Tracking

Log soil moisture readings alongside every assessment. Spot the dry and waterlogged zones driving stress — and time your irrigation to the data.

Ball Speed Tracking

Record green speed over time and see it next to turf health. Prove the surfaces are playing consistently — and catch drift before members do.

Your whole course, at a glance

Every assessment rolls up into one live view — course health score, stress breakdown, and trends over time. Drill into any hole or zone in a click.

  • Live course health score across all holes
  • Healthy and stressed ratios per zone
  • Recovery and decline trends over weeks and seasons
  • Ball-speed and moisture tracking where captured
  • Board-ready monthly reports, exported in a click
Grass Buddy dashboard screenshots showing turf health analysis, trends, ball speed and course performance reports

4-Week Trial — No Cost

Test whether Grass Buddy adds real value to your course management by building a consistent visual record of your known turf pressure areas.

Week 1
Baseline Assessments
Starting conditions captured
Week 2
Repeat Assessments
Early change visible
Week 3
Continued Tracking
Recovery/decline trends emerge
Week 4-5
Final Review
Visual report + go/no-go decision

What's Included

  • No cost — full access for 4 weeks
  • System configuration and training
  • 2 selected holes
  • 3–5 priority zones per hole
  • 2–3 assessments per week
  • End-of-trial review and report

What Grass Buddy Tracks

  • Hole and zone locations
  • Turf photos and health scores
  • Health and stress percentages
  • Healthy and stressed ratios
  • Field notes and observations
  • Assessment history and trends

See Grass Buddy on your course

Tell us about your course and we'll arrange a walkthrough or start your free trial.

We'll respond within one business day.